German Election 2017
The data that I used for this analysis is hosted at Kaggle. The dataset caught my attention because I enjoy plotting data on maps. I recently discovered the sf package in R, so I used this as an opportunity to learn it. Find out more about the package here at https://github.com/r-spatial/sf.
The dataset deals with the German 2017 Election Results and how votes were distributed among regions. I wanted to visualize the results of the German Election at both the State and District level. In Germany there are two separate votes, and you can learn more about the Electoral System in Germany here.
I concentrated primarily on the second vote because according to Wikipedia, it is the more important vote:
For the distribution of seats in the German Bundestag, the second vote is more important than the first vote. This second vote allows the elector to vote for a party whose candidates are put together on the regional electoral list. [Wiki]
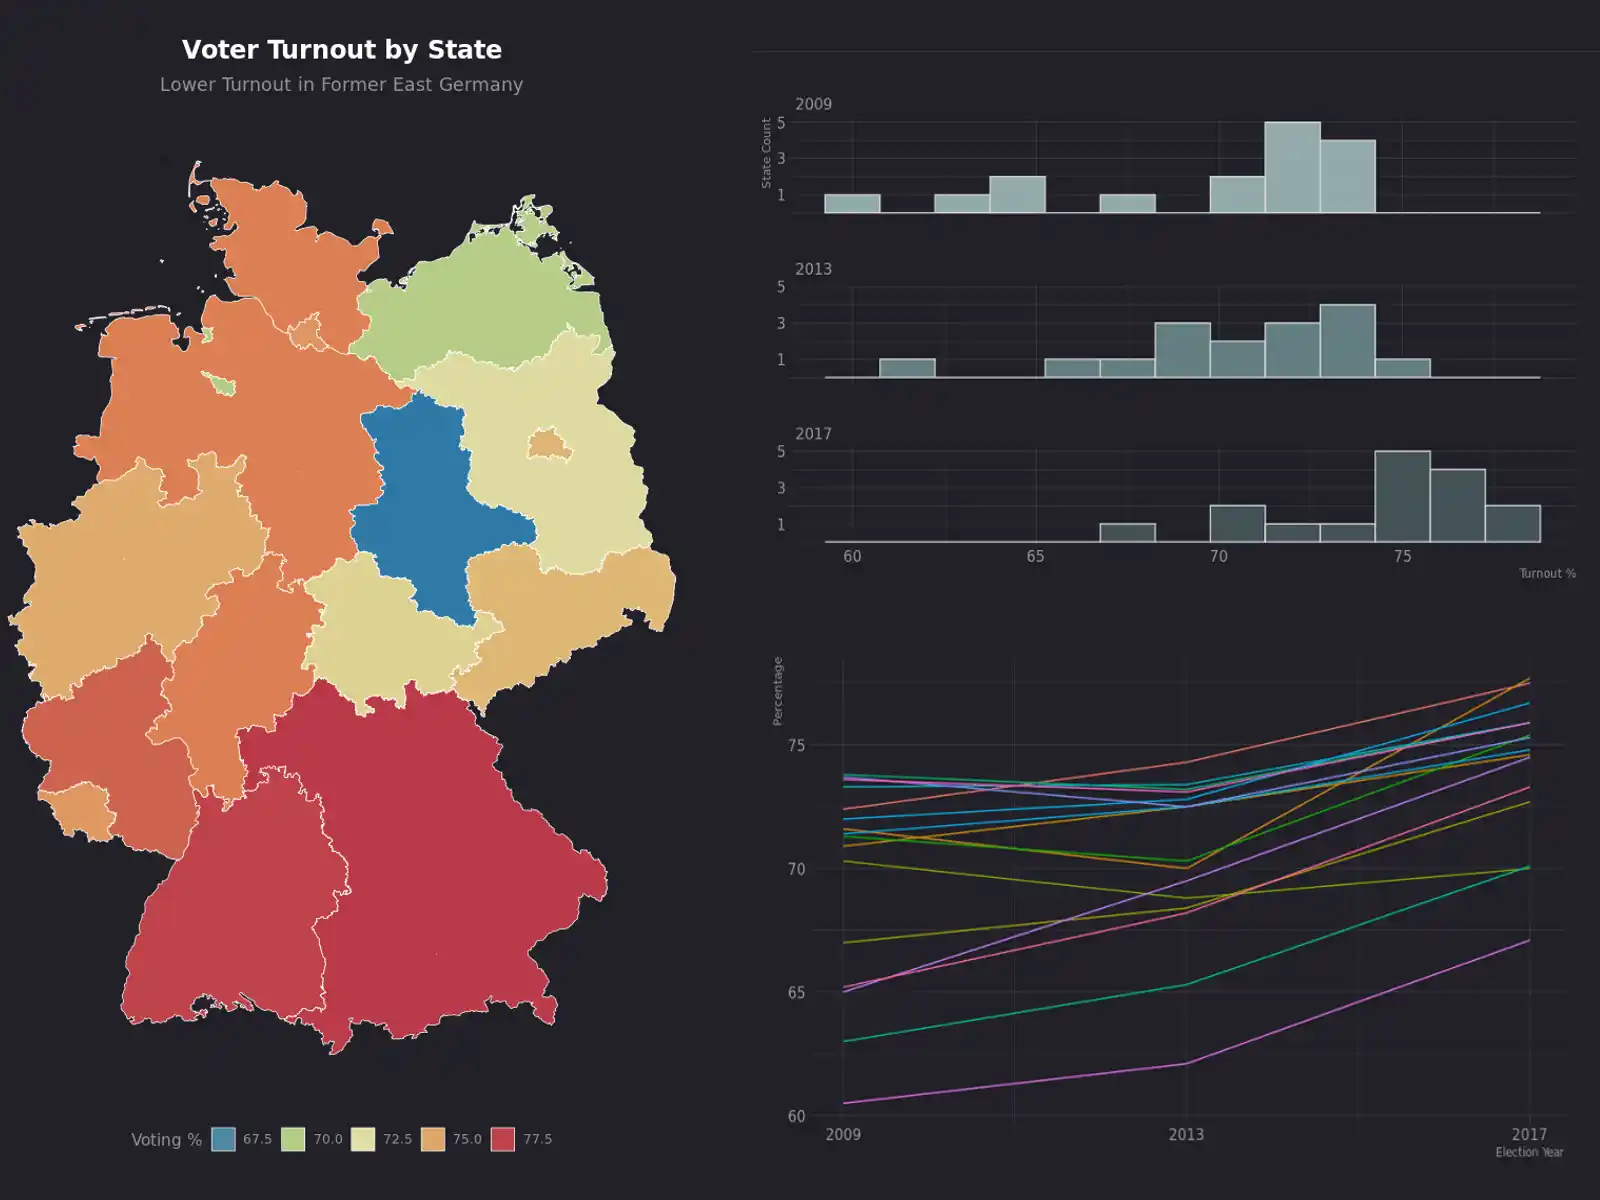
Voter Turnout
It appears that voter turnout has increased over the past three election cycles. There appears to be a higher turnout in the southern states of Baden-Württemberg and Bayern.
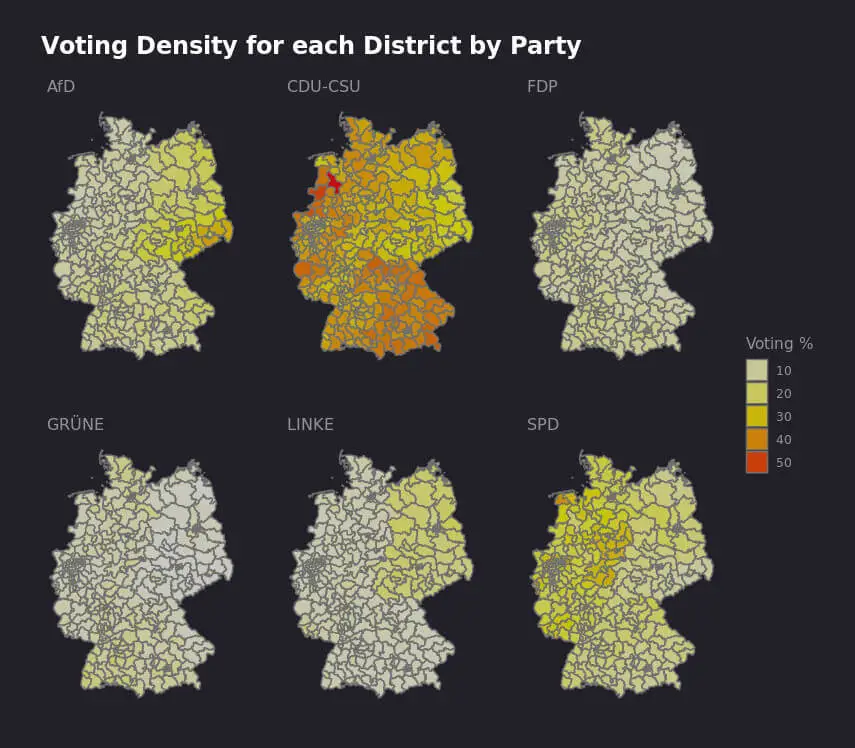
Voting Distribution by Party
Distribution by regions
It turns out that where you live indeed plays a role in who you vote for. In these maps, you can see that AfD and die LINKE were highly concentrated in the former DDR, while die GRÜNE has a large presence in former West Germany.
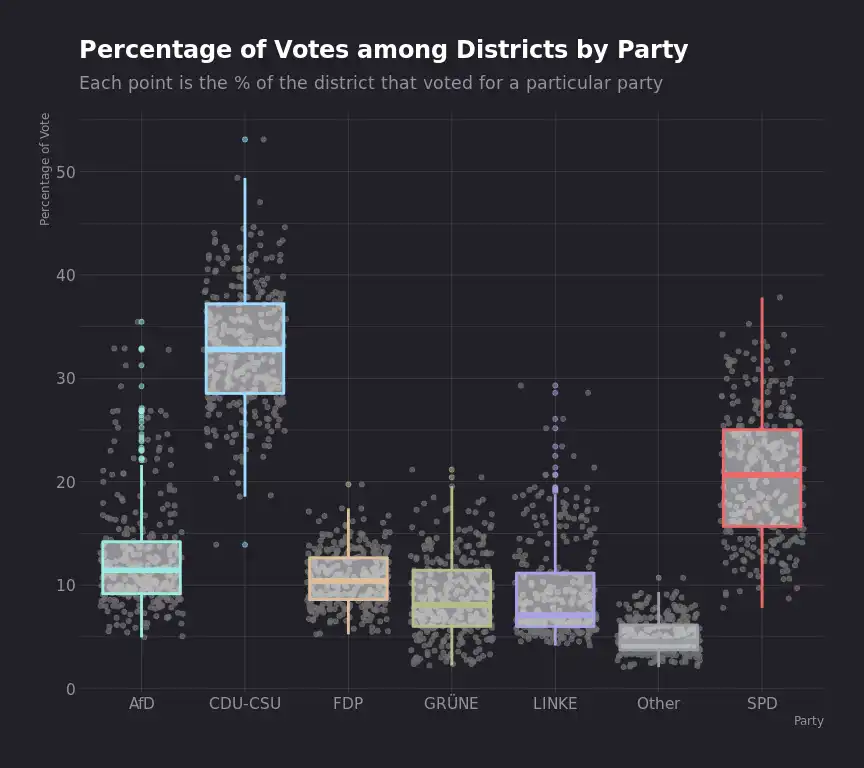
Distribution of individual districts
The points in the box plots are markers for each district, while the box aspect portrays how narrow or wide the distribution is. From looking at the plot, AfD and die Linke have many outliers.
On the contrary, FDP has a similar median as AfD, but FDP has low variation among districts while AfD has very high variation and a handful of big outliers. Notice how die LINKE also has its share of outliers.
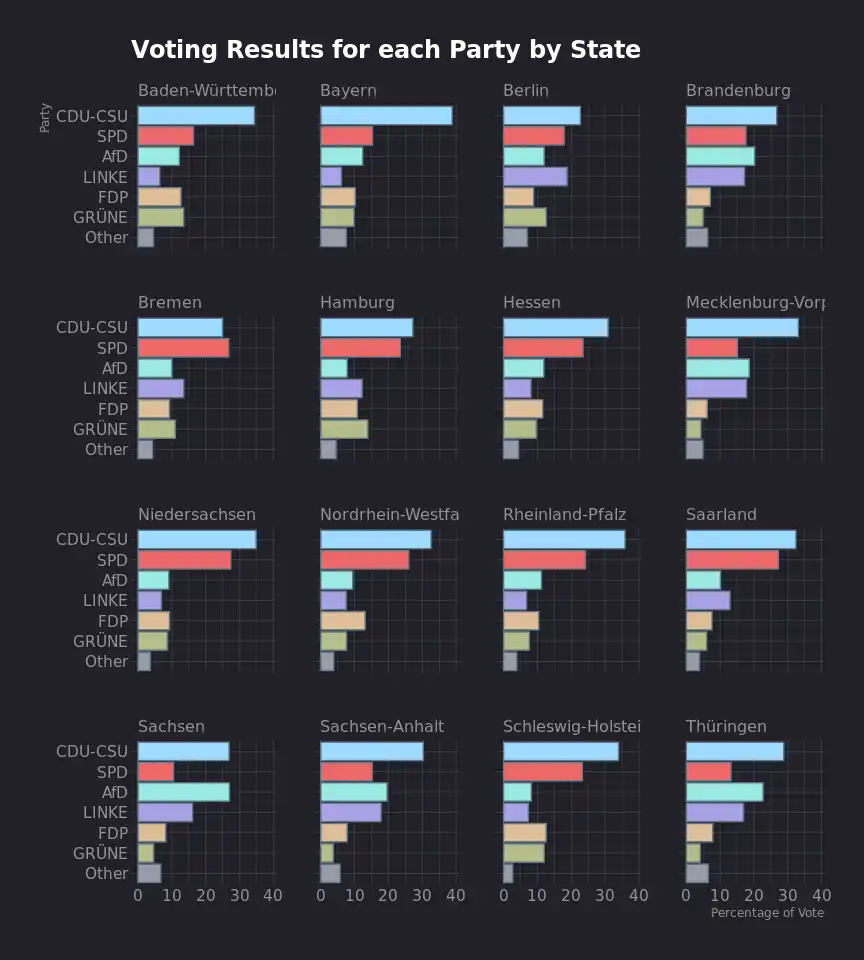
Voting results for each state
These bar charts show how voting for individual parties were distributed among different states (Bundesländer). In most states, CDU-CSU dominates the vote; however, that is not always the case.
Berlin proves to be a very diverse place to live politically (makes sense). Also, AfD in Sachsen is on par with CDU-CSU, which must have been a surprise in this past election.
Conclusion
I highly recommend checking out the sf package if you get your hands on some geo-spatial data and want to plot it. The package makes it easy to get up and running and integrates well with ggplot2.
Going forward I think it would be interesting to see if:
- voter turnout continues to increase in the next election
- regions become more or less polarized regarding who they vote for
Have a look at the source on GitHub if you are interested in replicating the analysis.